Beginning April 14, 2023, Note our NEW Address: 100 Jericho Quadrangle, Suite 233, Jericho, New York 11753

The Quarterly Forecast

ISSUE 4 : AUGUST 2019

U.S. companies are moving all or parts of their supply chains out of China and into developing Southeast Asian markets with increasing frequency due to the ongoing trade war between the two economic superpowers, with additional ramifications yet to be determined.

 Issue 4: August 2019

Joe’s View

Executive Summary by Joseph Barry, President & Founder

Joseph Barry

Gradual migration of supply chains out of China in favor of Southeast Asia began long before President Donald Trump began slapping tariffs on Chinese goods. Cambodia, Vietnam and Bangladesh, for example, have all experienced tremendous trade growth, relatively speaking, throughout the last decade or so, with Washington’s recent penchant for utilizing tariffs as its main negotiating tool further exacerbating the associated supply chain consequences.

With more than $250 billion in tariffs already imposed, and President Trump’s proposed plan to place tariffs on all remaining commodities from China creating even more uncertainty, it is difficult to gauge just how worried we should be about blanket duties actually coming into fruition. The Trump administration has been hesitant to pull this additional $300 billion trigger, announcing at the conclusion of June’s G20 summit—a two-day meeting of 19 countries and the European Union (EU) representing most of the world economy—it would hold off on executing this fourth round of tariffs “for the time being.”

Trump has good reason to ease up: Election time is nearing, and this next wave, which would include apparel and footwear, would devastate mega-retailers such as Walmart and Target and affect the ultimate consumer drastically—Middle America, specifically, the president’s powerbase. To date, Trump’s China tariffs have already cost $16 billion in bailouts to burned farmers, whose backing is crucial for Team Trump come election season. A study by the Federal Reserve Bank of New York suggests 2018 tariffs have cost the average household $419 annually.

No matter the escalation and duties ultimately levied, it’d be impossible to replace the so-called “Sleeping Giant” entirely, but other countries are certainly benefiting from the shift right now. Those for whom a move away is inevitable are advised to reconsider their logistics partnerships, as many forwarders and brokers working out of China are inexperienced in developing Southeast Asian markets. With significantly less-stable infrastructure than China, the importance of well-established relationships in the region cannot be overemphasized.

Moving-Supply-Chains

As always, we will continue to monitor the situation and provide extraordinary freight forwarding and logistics services to our clients, no matter the seas ahead.

Moving Supply Chains Out of China

As aforementioned, it’s important to recognize that supply chain shifts away from China were already in the works, yet on a less-immediate time frame. Companies were already moving out because trade there was getting expensive with or without new tariffs. Now, however, for supply chains to continue operating within budgets, there is no choice but to look outside its borders—an urgency propelled by the constant threat of tariffs. Trump’s trade war is simply creating an environment where the inevitable is occurring sooner rather than later.

At CAF Worldwide, we’ve had several customers who’ve already moved small pieces of their supply chains to Cambodia, Vietnam or Bangladesh, depending on their commodities. Longer-term, we’re talking with supply chain managers who will be moving as much production as they can—again, depending on the commodity.

The key for these supply chains right now is to pay close attention to their service providers. What we’re seeing is an eagerness to move supply chains around, but an uncertainty about where exactly to go. If you’re using a freight forwarder out of China and now trying to work in Central America or Southeast Asia, that provider might not be the best choice for you.

Oftentimes, importers work within very specific niche markets, so we’ve also had people reaching out to us looking for capacity within these. We anticipated this. Everybody is moving their suppliers to other markets, where they don’t have a lot of contacts, so they’re struggling with unprecedented issues pertaining to space. Many forwarders work exclusively out of China and the United States. If you are going to work with one of these forwarders that has no infrastructure within the markets you are trying to break into, you are going to struggle—there’s just no two ways about it. 

That’s not to say these forwarders are incompetent. Most still in business today following the major shakeout during the last decade and hyper-competitive markets of recent years are more than capable, but forwarders have decidedly distinctive strengths. For example, while one may be fantastic in China, if you move to Vietnam, it might not have a good office there, might not have contracts there, might not have enough volume there. That makes it difficult to provide the same level of service. It’s not to say it’s not a good company, it’s just that certain lanes may not be in their wheelhouse, so to speak.

Bangladesh, for instance, is one of the most difficult markets in the world, logistically, but its labor costs are significantly cheaper than in China, and the country is known to produce high-quality goods—cotton, specifically. If you do not work in Bangladesh, and you have a client who moves there, you’re not going to be successful right away. Cambodia is similar in that way. Its infrastructure leaves much to be desired, and the same can be said of its port systems. All other things being equal, if you do not know the right people or have the right contacts, it can be very challenging, if not downright defeating.

TEU-market-share-of-US-footwear-imports-from-Asian-countries

Vietnam: Footwear Powerhouse

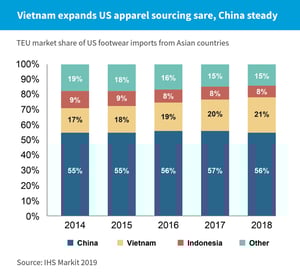
“Footwear is a funny thing—it’s highly specialized, so it’s one of the harder commodities to move out of China, because they have the technical knowledge and manufacturing capabilities, but Vietnam has been creeping up on them.”

  • According to PIERS, a sister product of international shipping and logistics news and analysis site JOC.com within global information provider IHS Markit, Vietnam has seen a steady increase in both market share and volume for U.S. imports throughout the last five years.
  • Market share has increased by about a percentage point, annually.
  • Volumes were up 12.5 percent year over year, to 161,171 TEU.
  • Vietnam’s footwear imports to the United States have almost doubled in the past five years, while its market share for U.S. footwear sourced from Asia has risen to 24.2 percent.


More Tariff Threats

In May, President Trump threatened to impose tariffs on all goods imported from Mexico beginning at 5% and increasing another 5% each month before reaching their peak at 25% in October. The threat was retracted soon after, with President Trump citing an agreement regarding immigration legislation as the reason.

Additionally, in May, the Trump administration warned the EU about potential levies to be placed on imports, worth about $21 billion. A decision is expected regarding $7 billion in EU tariffs by summer’s end.

Mexico

  • The immigration agreement President Trump is referring to would advance a program known as the Migration Protection Protocols, which sends those seeking asylum in the United States to wait in Mexico as their cases are processed. (Reuters)

EU

  • The list of EU imports in danger of being slapped with new tariffs includes: cashmere, cotton, handbags costing more than $20, wool sweaters and vests, and other wearing apparel items. It also includes certain food and beverage items, such as certain cheeses and liquors.
  • The EU is expected to respond with retaliatory tariffs on roughly $22 billion in imports from the United States.

CAF-QF-Plane


Automation at the Ports

In our last report, we covered proposed automation at the Port of Los Angeles regarding reefer containers, a project that remains ongoing. A recent report by Moody’s Investors Service predicts  automation not only implemented for high-risk reefer containers, but also high-volume gateways in North America and Europe that generate local as well as discretionary transshipment cargo.

The need for automation is necessitated by growing vessel sizes and container exchanges. Mega-ships call for the ability to stack containers higher and higher, without loss of productivity.

“With the ability to deliver multiple benefits beyond labor savings, we expect adoption of automation to increase, both globally and in the U.S. and Canada,” states Moody’s June 24 report.

While automation at major ports certainly presents political and social risks, it is important to note that only 3% of about 1,300 container terminals worldwide have been automated. For the most part, longshoreman jobs and labor unions are not under siege.

Carrier Consolidation

Some developments in 2018 and through the first half of 2019 hint at carrier behaviors moving toward strategies leveraging the novel carrier oligopoly of recent years to more directly benefit carriers.

The majority of all capacity on east-west trades is controlled by just three alliances. Carriers are getting better at manipulating supply by withdrawing capacity, with the goal of increasing freight rates.

Our advice to shippers: Rethink your procurement strategies, and plan for blank sailings when negotiating contracts... or let CAF Worldwide do it for you.

Issue 4: AUGUST 2019

Trade Lane Notes

Insights from Torie Coleman, Director of Operations

Torie Coleman

synopsis

As previously stated, carriers are not shying away from using blank sailings to curtail capacity growth. Carriers expect a weak peak season due to the ongoing tariff dispute, so blank sailings in the trans-Pacific should be expected.

CAF-QF-World-Container-Index
Source: The World Container Index assessed by Drewry, a composite of container freight rates on eight major routes to/from the United States, Europe, and Asia

The Breakdown

  • Trans-Pacific eastbound spot rates have been consistently declining alongside China import volumes, and the threat of more tariffs continue to loom overhead. The only way for container lines to protect peak-season bottom line is to schedule more blank sailings.
  • “We expect an uptick in voided sailings in July, and a further uptick in August,” says Blake Shumate, COO at multi-modal transportation management firm American Global Logistics.
  • Containerized exports from Vietnam to the European Union are expected to increase through 2020 due to a recent free-trade agreement signed. The agreement took nearly six years to cement, but was agreed upon in Hanoi on June 30. it  gradually erases 99% of customs duties between the two parties over the course of 10 years.
  • A survey by the American Chambers of Commerce for Shanghai and China found that more than 40% of U.S. businesses currently working out of China were either exploring such an option, or had already begun moving its operations. Of those, 25% have taken their business to growing markets in Southeast Asia.

THE BREAKDOWN

Global Economic Forecast

Significant unresolved issues continue to impact and dictate such growth, chief among these, ongoing uncertainty regarding trade tensions between the United States and China—with threats of an additional $300 billion in tariffs on nearly all remaining Chinese imports, including apparel, weighing heavy on the minds of retailers and freight forwarders alike. The U.K.’s impending departure from the EU without a transition agreement—referred to as a so-called “no-deal” Brexit—along with weakened business confidence, the tightening of financial conditions in emerging markets and advanced economies, and higher policy uncertainty across many economies, are other associated concerns.

Alternately, stimulus efforts by China, global central bank loosening, and a meaningful trade resolution between the United States and China could nullify the negative effects of the current tariff war, or at least help move closer to economic equilibrium.

Other key pieces of the puzzle include:

New NAFTA

  • In May, the United States moved to halt steel and aluminum tariffs placed on Canada and Mexico to appease demands from both countries and move forward with the so-called “NAFTA 2.0,” the United States-Mexico-Canada-Agreement, or USMCA.
  • In June, Mexico became the first country to ratify the agreement. The Trump and Trudeau administrations both signed the deal in November, but have yet to ratify the trade agreement. Washington may be postponing approval due to potential political ramifications as election time nears.
  • Trade figures may not fully normalize until we have more clarity into the U.S.-China agreement.

Trade Tensions

  • 2019 showed signs of equity market recovery, but tariff increases in May by the Trump administration on Chinese imports put a stop to that. The promising nature of a stock market rebound has been tempered by falling long-term bond yields, an inverted U.S. yield curve, and unsatisfactory global manufacturing surveys.
  • Even though the economy remains relatively strong, the Fed is considering cutting interest rates in July and September.
  • A slight global economic slowdown continues to worry economists and shippers alike, but the downturn is likely contingent upon intensifying trade disputes and not necessarily a sign of an impending recession. Regardless, the ultimate results may severely impact economic activity and longer-term development prospects.
  • JPMorgan’s tracker of global business capital expenditure showed a drop in business investment spending for Q2, after displaying promising growth through 2018, which suggests the ongoing trade war is dampening market confidence, and ultimately, harming international trade.

Container Trade

  • According to Drewry, an independent maritime research consultancy, global port throughput growth is predicted at 3.0%, or 806 million TEUs. That is a .9% drop from its previous prediction of 3.9% growth. Last year’s global throughput growth was recorded at 4.7%.

Download Now

Save this issue as a PDF to print or share instantly

Quarterly Forecast

Or, download the most recent issue of The Quarterly Forecast now.