Beginning April 14, 2023, Note our NEW Address: 100 Jericho Quadrangle, Suite 233, Jericho, New York 11753

The Quarterly Forecast

ISSUE 6: JANUARY 2020

 A range of global issues continue to create uncertainty amid fears of an economic slowdown. However, a disappointing “peak season” for shipping may have more to do with improved technologies and processes than the impact of trade wars.

ISSUE 6: JANUARY 2020

Joe’s View

Executive Summary by Joseph Barry, President & Founder

Joseph Barry


The current logistics/supply chain landscape is still very uncertain due to many variables. There will be a trickle-down effect leading to more blank sailings, shippers continually moving their supply chains out of China, and carrier consolidation. These are the top variables affecting this situation, and there’s still more to come.

The tariff uncertainties are still a major item to watch. Even though a Phase One Trade Deal will be signed between the United States and China on Jan. 15, I don’t feel things will immediately move in a positive direction. This is because our industry will still feel the after-effects of the earlier increases.

We’ll also be watching what comes of talks in Beijing for a “Phase Two” trade deal referenced in a Dec. 31 tweet by President Donald Trump.

Even before tariff increases, U.S.-based shippers were starting to move out of China to countries such as Vietnam, Bangladesh, and Mexico. While this has been an ongoing trend for a number of years, it’s now more common, with Vietnam continuing to attract an increasing share of the market.

CAF has had a large presence in these regions for the last several years, as many of our footwear and apparel customers have relocated in search of relief from some of the highest tariff rates in the industry.

According to industry trade group the Footwear Distributors and Retailers of America (FDRA), footwear is one of the most heavily tariffed consumer goods. As the group’s website notes, these rates are currently “averaging 11% but reaching upwards of 48% and 67.5% on certain footwear types.”

The FDRA also notes that “99 percent of all shoes currently sold in the United States are imported, with 70 percent of these imports coming directly from China.”

Trade wars aside, we did see a positive for our industry with successful renegotiation of the United States-Mexico-Canada (USMCA) Agreement.

Formerly known as the North American Free Trade Agreement (NAFTA), USMCA was not expected to be up for vote until after the elections later this year. This will be good news for the North American region, as it’s expected to decrease the current level of market uncertainties.

The Trickle-Down Effect

As aforementioned, it’s difficult to predict our industry’s future. It will be market-dependent, and with Chinese cargo down, shipping rates are decreasing. While this is theoretically good for importers, lower rates also impact carriers, the decision makers when it comes to sailings and cargo space.

As such, we are currently in a holding pattern, and I see that continuing for a while. Even with the December tariffs decision, the status quo in the industry is likely to remain, and I expect conditions in the coming year to be on par with the last quarter of 2019.

Continuing trends are likely to include decreased volumes and an increasing number of shippers looking at regions outside of China. However, while moving operations can help shippers to offload the tariff increases, some of these alternative regions still lack the infrastructure needed for a solid supply chain.

The tariffs have had a significant impact on shippers related to the aforementioned trickle-down effect, causing industry disruption. This leads to lower volumes, causing carriers to cancel sailings. Less freight translates to lower profitability, and shippers are left with increased costs and lower service levels.

This unpredictability becomes more challenging for freight forwarders and our customers, because we rely on the carriers to provide us with a service. When that  process is disrupted by more blank sailings without notice, it creates supply chain issues for our clients.

We are positioned to help our customers navigate this process, especially as service levels continue to fall due to current industry standings. This could involve researching other production areas with lower rates, an overall production cost analysis, or help with navigating the U.S. Harmonized Tariff Schedule (HTS).

Joe's View


Logistics Automation Update

As noted in Q4 of 2019, automation has been a major discussion topic in the industry recently. However, I don’t think we’ll see much movement on automation—at least not in the coming year.

Most of the industry agrees that we need to move to an automated platform at some point. However, this is slow-going, and many are technology-resistant.

This resistance will need to change, but there will be difficulty, and it will be a slow and steady march. This is due in part to the disjoint of so many different production layers, players and stakeholders involved.

Issue 6: JANUARY 2020

Economic Insights

Economic Analysis by Michael Obuchowski, Ph.D, Founder & Chief Investment Officer, Merlin Asset Management

michael

synopsis

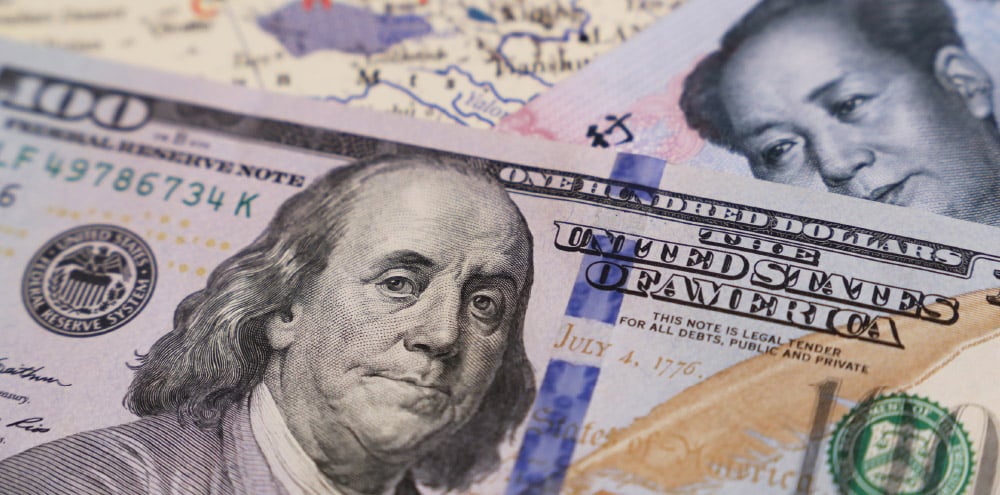
The world has adjusted to the new normal of economic policies as driven by the United States-China trade war.

Economic Insights


the breakdown

The Current Status

Thinking about the current global economic environment, it’s essential to remember where we were when Trump was elected U.S. president. During that time, the global economy was in an unusual period of synchronized growth while continuing to recover from a severe recession.

The subsequent worldwide economic deceleration was primarily a result of adverse economic and trade policies from the U.S. administration. This is rather than the typical end of an economic cycle, when central banks raise interest rates and strangle the economies to contain inflation, which usually picks up during an expansionary period.

There were many reasons to feel uneasy about economic growth in 2019:

United States-China Trade Wars = Worldwide Disruption

  • The United States-China trade war brought a slowdown to China’s economy, affecting global economic growth. European growth also slowed primarily because of the decrease of exports by Germany–the largest and most export-oriented economy in Europe. China is Germany’s third-largest export market, so any slowdown in Chinese demand causes a downturn in Germany, and the European economy as a whole.
  • The continuing threats of the United States trade war with the EU or India kept the observers alert. The Brexit travails contributed to the uncertainty of expectations and were an additional factor in companies curtailing their long-term investment plans.
  • With threatened and actual trade wars looming within the United States, and  Brexit stealing most of the limelight, there hasn’t been much attention drawn to  an intense economic and political conflict between Japan and South Korea—the third and 11th largest world economies, respectively.
  • The trade policies have negatively affected overall U.S. economic growth; GDP growth decreased to an estimated 2.1% from 3% in 2018.
  • The global trade war is undoubtedly hurting all global manufacturing sectors, including within the United States. The services sector is typically not directly affected by the trade war, and continues to expand with growth of all economies.


Durable Goods & Manufacturing

U.S. demand for durable goods (designed to last for more than three years) was mostly trending higher during the second half of 2019. This was an improvement from the first half of the year, when concerns about a global economic slowdown and trade policy hurt U.S. factories. These continue to affect the U.S. economy, with data from the Commerce Department (see below) showing continual slow growth in manufacturing and business spending.

  • Consumer data continues to be quite different from the lackluster demand for durable goods. Consumers have boosted their spending toward the end of 2019.
  • Household spending is rising seasonally at adjusted 0.4 percent in November vs. October, and 2.4 percent higher than a year ago.
  • Personal income also rose 0.5 percent in November after a 0.1 percent increase in October. With low unemployment and increasing persona incomes, consumer confidence also remains high.
  • The University of Michigan Consumer Confidence Index rose to 99.3 in December, up from 96.8 in November—the highest level since May.

The 2020 Outlook


The 2020 Outlook

The world has adjusted to the new normal of economic policies driven by the U.S. trade war. The initial shock was largely replaced by efforts to navigate and contain the damage caused by these events.

  • The central banks responded to the slowing economy and trade war threats by reverting to rate cuts due to recent interest rate hikes. I expect these rates will either hold steady or be cut further.
  • This will hold if economic growth does not improve with the (at least partial) resolution of the trade wars.
  • I see the upcoming Phase One U.S.-China agreement as an essential step toward decreased intensity of these countries’ current trade conflicts. It’s important to note this is a temporary placeholder, rather than a long-term solution to current China practices. 
  • The aforementioned agreement will facilitate a more open Chinese economy. Notwithstanding, China has been cutting import tariffs since 2017 to boost domestic consumption and increase economic growth. Subsequent to the increased trade wars, China accelerated tariff cuts to encourage local firms to make purchases from other markets and develop relationships with other countries.
  • Other developments include the ratification of the United States-Mexico-Canada (USMCA) Agreement, which was renegotiated from the former North American Free Trade Agreement (NAFTA).

Recession vs. Growth?

As aforementioned, we have experienced slowing economic growth during 2019, specifically within manufacturing. Therefore, many observers are concerned about whether the downturn could turn into a recession.

  • At the end of 2019, confidence about the future was at a new low. The most recent monthly Conference Board Leading Economic Index (LEI) was unchanged after three negative months (all at -0.2).
  • The LEIs, which are primarily based on manufacturing variables with no direct service sector indicators, were created to be a recession forecasting tool. Three negative readings in a row are assumed to be a good predictor of a likely imminent recession.
  • Some debate the LEIs aren’t accurate regarding the current U.S. economy. This is because more than 90 percent of the new jobs since the recession are from the service sector. With consumer confidence and services remaining stable, the LEI is said to have limited usefulness in predicting future economic growth.
  • These results suggest a recovery from 2019 lows with continuing economic growth momentum, strong services sector performance, and a steady expansion in manufacturing.
  • While overall growth remained muted, there was a renewed rise in export orders. I feel these improvements will limit the probability of recession with an improved 2020 economy.

Issue 6: JANUARY 2020

Trade Lane Notes

Insights from Torie Coleman, Director of Operations

Torie Coleman

synopsis

Blank sailings will increase, while trade lane routes will decrease.This is due to carrier consolidation and alliances, and a more than 20-percent drop in tariff-laden United States-China trade.

World Container Index: Assessed by Drewry, $/40ft container
Source: The World Container Index assessed by Drewry, a composite of container freight rates on eight major routes to/from the United States, Europe, and Asia

synopsis

United States-China Trade Wars

Increased tariffs were a hot topic of 2019. The last quarterly forecast discussed a 15-percent increase on $120 billion of Chinese imports. Known as List 4A, this was raised on Sept. 1, 2019. 

A second $156 billion increase was scheduled for Dec. 15. Known as List 4B, this would have potentially added a 15-percent additional duty on already heavily tariffed items, such as footwear and apparel.

President Trump announced via a Dec. 13 tweet that List 4B increases would not occur. This is due to the United States and China agreeing to a “Phase One” trade deal.

According to a report from the Office of the U.S. Trade Representative (USTR), the United States will maintain “25 percent tariffs on approximately $250 billion of Chinese imports, along with 7.5 percent tariffs on approximately $120 billion of Chinese imports.”

CAF-QF-Moving-Supply-Chains


With the List 3, 25-percent increase remaining, the previous List 4A increase of 15 percent will be lowered to 7.5 percent, per President Trump.

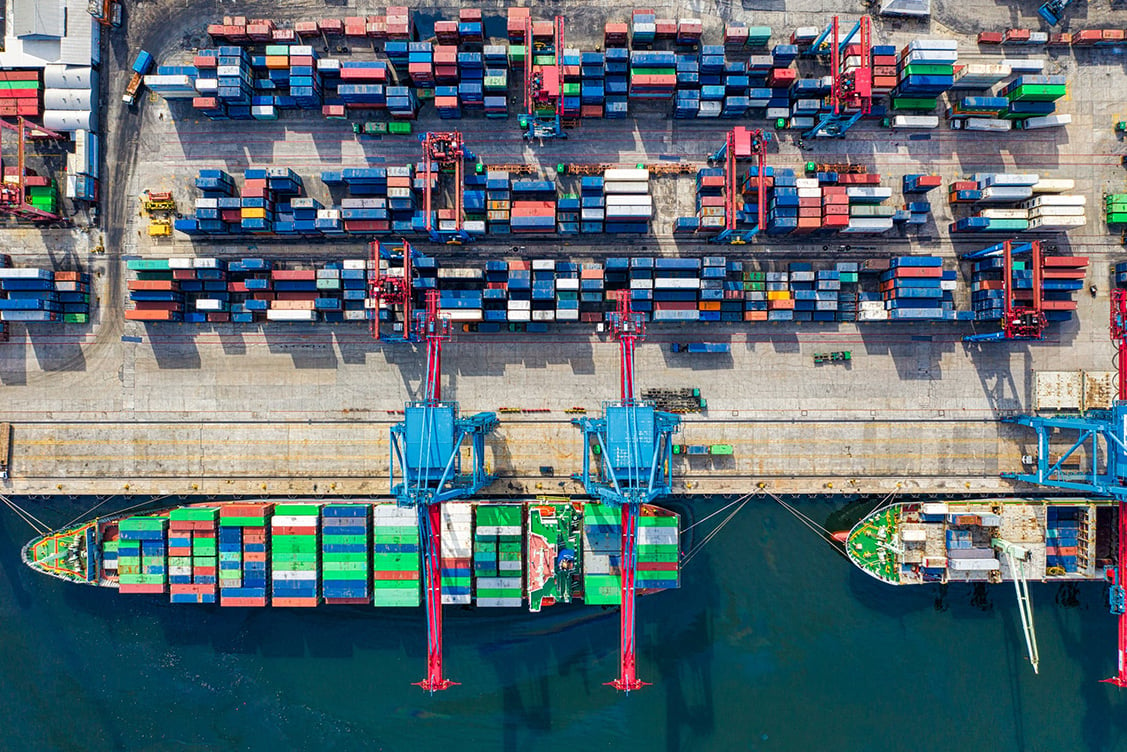
This effect will likely be the same as with other tariff announcements, in that U.S.-based shippers will continue looking outside of China. Expect additional activity from regions such as Central America, Mexico, Bangladesh and South America. Of course, Vietnam will continue its consistent 10-year uptick.

Tariff increases will also cause Chinese exports and imports to decrease. This will trickle down to carrier rates, port fees, and supply chain transportation elements on the United States-China route.

Blank Sailings

In the previous Quarterly Forecast, we mentioned 37 blank sailings occurred in October and November. This will continue into 2020, and we expect the overall number of blank sailings to be higher than in previous years.

There will be additional pressure for deleted sailings as carriers will incur additional charges per the upcoming IMO 2020 interim low-sulfur fuel mandate.

Per a global ruling by the International Maritime Organization, and as cited by The Journal of Commerce, carriers “must reduce the sulfur content of bunker fuel to 0.5 percent, from 3.5 percent at present, or install emissions-cleaning scrubbers.”

2020 Predictions

Shippers should begin evaluating the specific carriers and forwarders with the most variety of sailings. This includes options of oceangoing carrier, air, and land transportation. The role of the freight forwarder will be even more vital in this environment, due to our communication with the shipper as to what is upcoming, and how we can help them navigate these changes.

Ocean Freight Carrier Consolidation

Freight demand is expected to decrease in some areas, such as the heavily tariffed China-United States routes. It will however, increase in regions such as Vietnam and Central America due to shippers moving away from Chinese production.

Cargo may decrease for the next year as it will be difficult to make up the 20-percent-plus trading drop between China and the United States.

With more carrier consolidation, there are fewer options for shippers. Aside from blank sailings, many carriers are halting stops within regions, such as the ports of Portland and Seattle in the U.S. Pacific Northwest.

A 2018 study for the Port of Portland, as cited on The Maritime Executive, advised that “[the port’s] disused container terminal will have to attract multiple new revenue streams if it is to break even.”

It also noted that Portland, like many others, will fall victim to blank sailings, resulting from ocean carrier consolidation, carrier partnerships, and larger vessels.

“The trend toward larger ships in the transpacific will continue, and there will be limited opportunities for Portland to attract a transpacific service due to vessel size limitations. Alliances control almost 90% of the transpacific freight. This is not a favorable condition for a smaller port like Portland,” the study concluded.

Download Now

Save this issue as a PDF to print or share instantly

Quarterly Forecast

Or, download the most recent issue of The Quarterly Forecast now.